اب سے ہم Elev8 ہیں
ہم صرف ایک بروکر نہیں ہیں۔ ہم ایک جامع ٹریڈنگ ایکوسسٹم ہیں—ہر چیز جو آپ کو تجزیے، ٹریڈ اور ترقی کے لیے درکار ہو، ایک ہی جگہ پر ہے۔ کیا آپ اپنی ٹریڈنگ کو بلند کرنے کے لیے تیار ہیں؟
ہم صرف ایک بروکر نہیں ہیں۔ ہم ایک جامع ٹریڈنگ ایکوسسٹم ہیں—ہر چیز جو آپ کو تجزیے، ٹریڈ اور ترقی کے لیے درکار ہو، ایک ہی جگہ پر ہے۔ کیا آپ اپنی ٹریڈنگ کو بلند کرنے کے لیے تیار ہیں؟
GBP/JPY takes the bids to 144.15 during Friday’s Asian session. The pair stays positive above 23.6% Fibonacci retracement of the pair’s October-December 2019 upside, which in turn shifts buyers’ focus to a downward sloping trend line stretched from December 13.
Should prices stay strong beyond 144.75 level comprising the aforementioned resistance-line, the yearly top surrounding 146.30 will return to the chart.
In a case where the bulls keep dominating past-146.30, 146.80 and 148.00 could offer intermediate halts during the rise to 150.00 psychological mark.
Meanwhile, a downside break of 23.6% Fibonacci retracement, at 143.85, can fetch the quote back to 21-day SMA, at 142.80 now.
Though, a three-week-old rising trend line and 38.2% Fibonacci retracement could challenge the bears amid the following declines around 141.50 and 141.30 respectively.
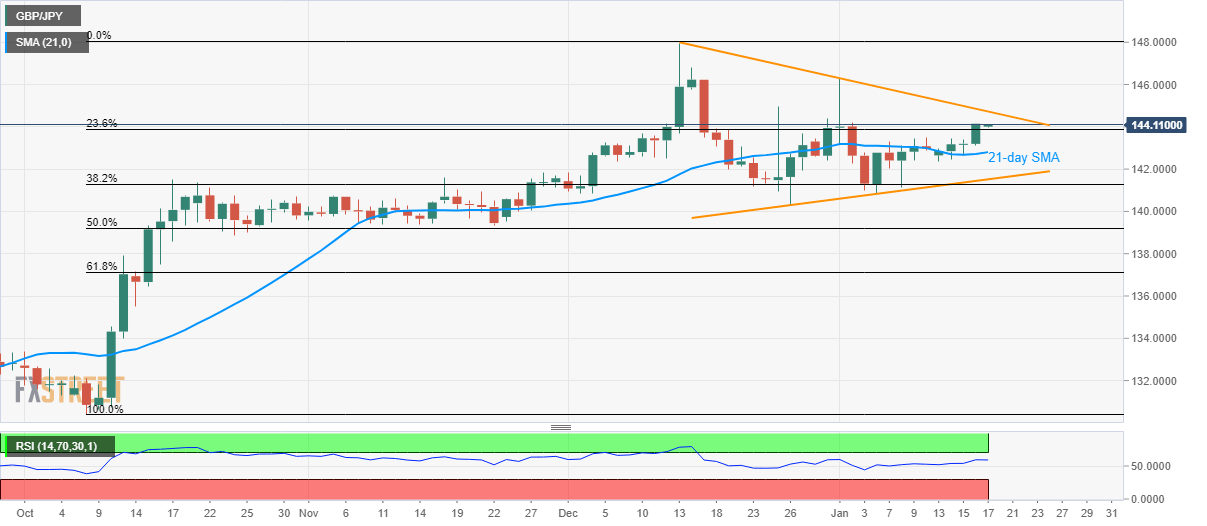
Trend: Bullish