Mulai sekarang kamiialah Elev8
Kami lebih daripada sekadar broker. Kami adalah ekosistem dagangan serba ada—semua yang anda perlukan untuk menganalisis, berdagang, dan berkembang ada di satu tempat. Sedia untuk tingkatkan dagangan anda?
Kami lebih daripada sekadar broker. Kami adalah ekosistem dagangan serba ada—semua yang anda perlukan untuk menganalisis, berdagang, dan berkembang ada di satu tempat. Sedia untuk tingkatkan dagangan anda?
WTI trades around $58.50 during the early Friday. In doing so, the oil benchmark fails to cross 50-day SMA despite taking a U-turn from 200-day SMA, also trading successfully beyond 50% Fibonacci retracement of the October-January upside.
Hence, traders will keep eyes on the black gold’s momentum either during its rise beyond a 50-day SMA level of $59.00 or on the downside break of 200-day SMA surrounding $57.70.
The 61.8% and 38.2% Fibonacci retracements, around $56.65 and $60.10 will be on the traders’ radar during the breaks.
If at all prices manage to remain strong beyond $60.10, the return of $62.50 can’t be denied.
On the flip side, oil price declines below $56.65 can fetch the quote to November 2019 bottom surrounding $54.90.
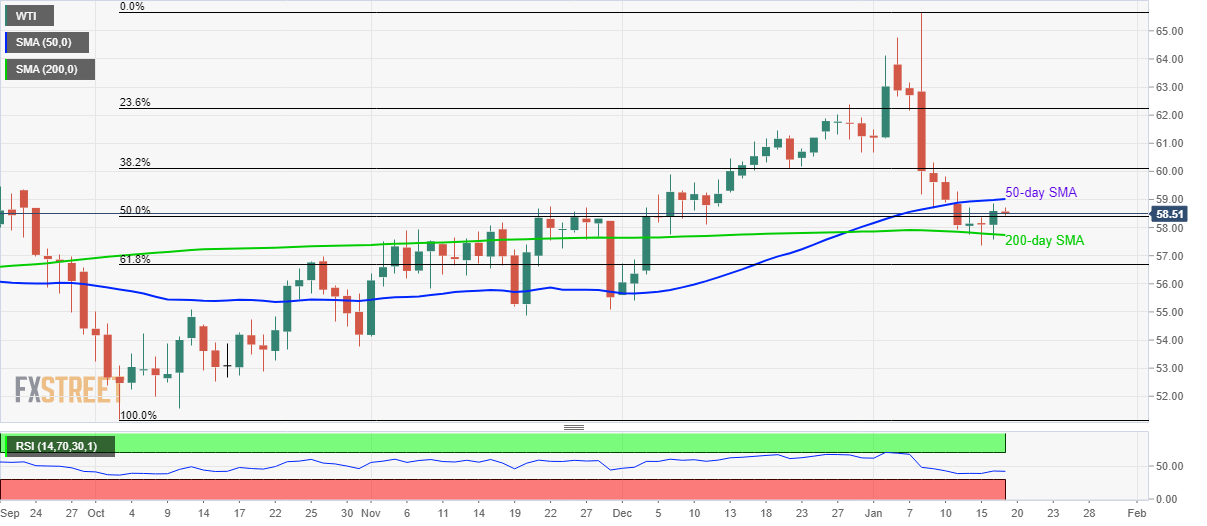
Trend: Sideways