Kể từ bây giờ chúng tôi là Elev8
Chúng tôi không chỉ là một nhà môi giới. Chúng tôi là một hệ sinh thái giao dịch tất cả trong một—mọi thứ bạn cần để phân tích, giao dịch và phát triển đều có ở một nơi. Sẵn sàng nâng tầm giao dịch của bạn?
Chúng tôi không chỉ là một nhà môi giới. Chúng tôi là một hệ sinh thái giao dịch tất cả trong một—mọi thứ bạn cần để phân tích, giao dịch và phát triển đều có ở một nơi. Sẵn sàng nâng tầm giao dịch của bạn?
EUR/JPY declines to 119.73 during the Asian session on Tuesday. While the pair’s sustained trading below 100-day SMA portrays its weakness around the lowest since November 22, 2019, further downside will be challenged by the short-term key support line.
In addition to the four-month-old rising trend line, currently at 119.60, 50% Fibonacci retracement of the pair’s rise from September 2019 to January 2020, at 119.40, also questions the bears.
Additionally, mid-October 2019 low near 119.10, as well as 61.8% Fibonacci retracement near 118.55, could also please the bears during the past-119.40 declines.
Alternatively, an upside clearance of 100-day SMA, currently at 120.50, needs to cross a downward sloping trend line since January 16, around 120.65, to question the monthly top of 121.15.
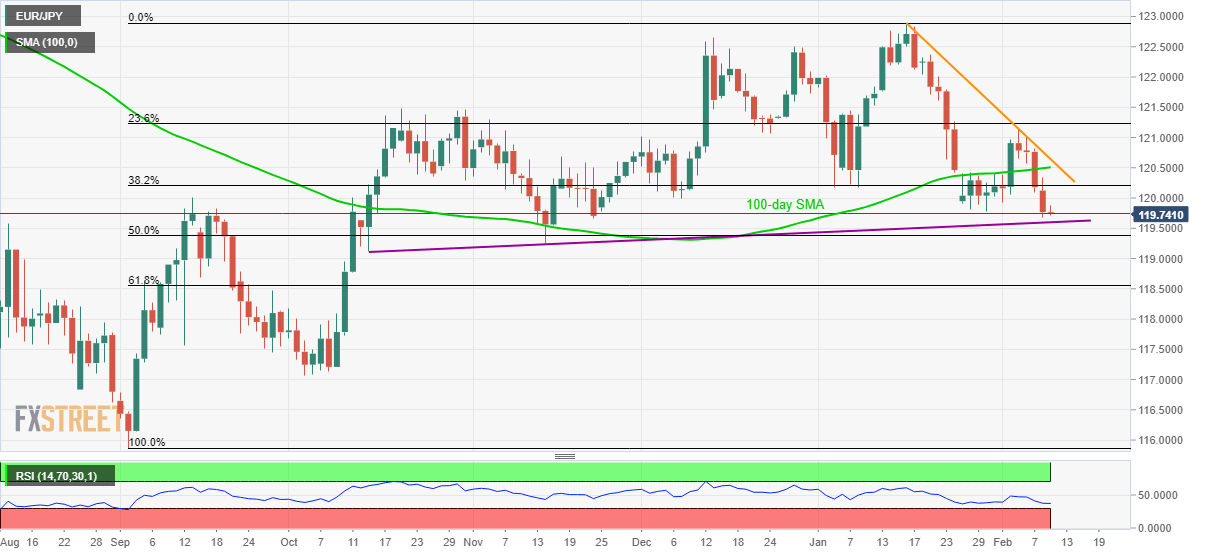
Trend: Pullback expected