Kể từ bây giờ chúng tôi là Elev8
Chúng tôi không chỉ là một nhà môi giới. Chúng tôi là một hệ sinh thái giao dịch tất cả trong một—mọi thứ bạn cần để phân tích, giao dịch và phát triển đều có ở một nơi. Sẵn sàng nâng tầm giao dịch của bạn?
Chúng tôi không chỉ là một nhà môi giới. Chúng tôi là một hệ sinh thái giao dịch tất cả trong một—mọi thứ bạn cần để phân tích, giao dịch và phát triển đều có ở một nơi. Sẵn sàng nâng tầm giao dịch của bạn?
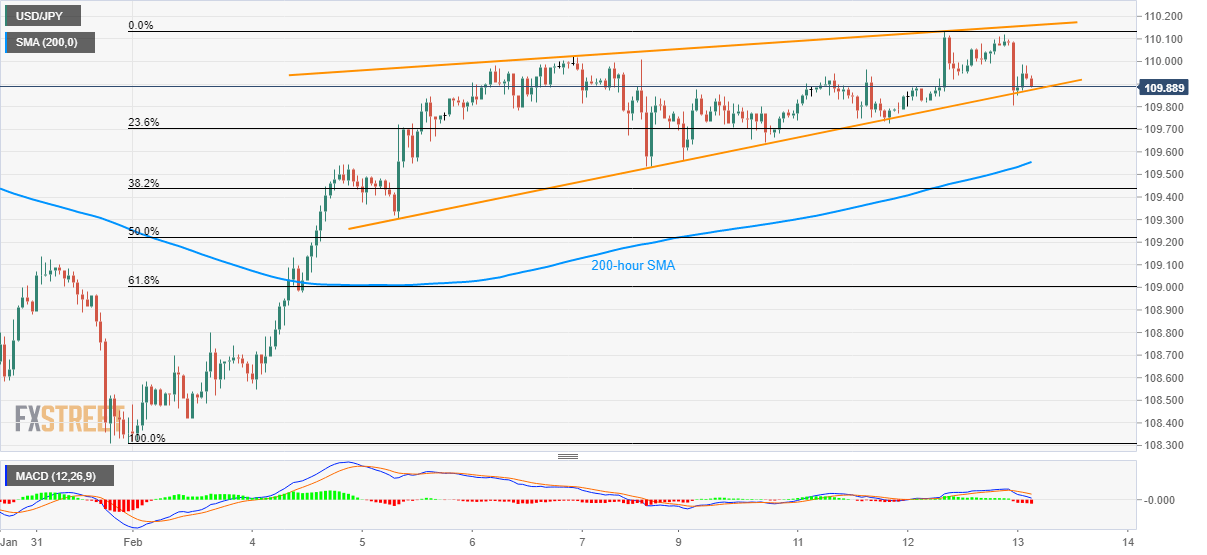
USD/JPY makes rounds to 109.90 while heading into the European session on Thursday. The pair recently declined from multi-day high, which in turn portrays a short-term bearish technical formation on the hourly chart.
Even so, sellers will need a sustained break below the pattern’s support of 109.80 to test a 200-hour SMA level of 109.55 and January 31, 2020 high of 109.13.
If at all MACD continues to flash bearish signals past-109.13, 108.60 and the monthly bottom around 108.30 will return to the charts.
Meanwhile, an upside break of Wednesday’s top needs to cross the pattern resistance of 110.20 and January 17 high of 110.30 to defy the bearish signals.
In doing so, buyers can take aim at May 2019 top surrounding 110.70.
Trend: Pullback expected
FXStreet Indonesian Site - new domain!
Access it at www.fxstreet-id.com