اب سے ہم Elev8 ہیں
ہم صرف ایک بروکر نہیں ہیں۔ ہم ایک جامع ٹریڈنگ ایکوسسٹم ہیں—ہر چیز جو آپ کو تجزیے، ٹریڈ اور ترقی کے لیے درکار ہو، ایک ہی جگہ پر ہے۔ کیا آپ اپنی ٹریڈنگ کو بلند کرنے کے لیے تیار ہیں؟
ہم صرف ایک بروکر نہیں ہیں۔ ہم ایک جامع ٹریڈنگ ایکوسسٹم ہیں—ہر چیز جو آپ کو تجزیے، ٹریڈ اور ترقی کے لیے درکار ہو، ایک ہی جگہ پر ہے۔ کیا آپ اپنی ٹریڈنگ کو بلند کرنے کے لیے تیار ہیں؟
WTI rises to $52.40 during Wednesday’s Asian session. Even so, the black gold stays below 21-day SMA while a bearish candlestick formation keeps the sellers hopeful.
That said, $51.00 can act as immediate support during the pullback whereas the monthly bottom surrounding $49.40 could gain market attention afterward.
If at all oil prices slip below $49.40, late-October 2017 low near $49.00 might return to the chart.
Meanwhile, the oil benchmark’s ability to cross the 21-day EMA level of $52.91 defies the bearish candlestick formation.
In doing so, January 29 high of $54.37 and January 15 low nearing $57.40 can flash on the bull’s radar.
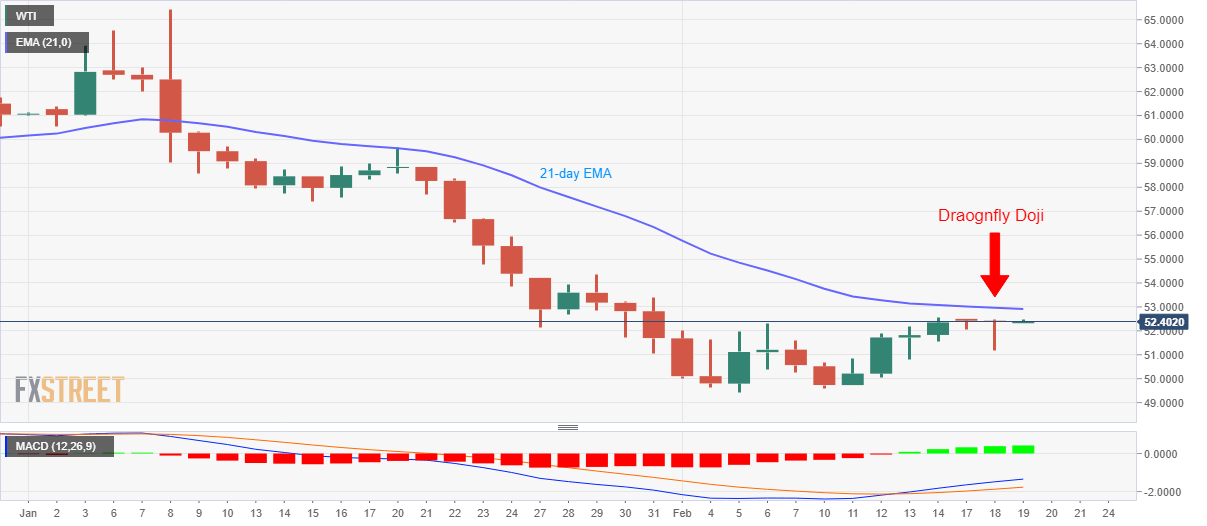
Trend: Bearish