Kể từ bây giờ chúng tôi là Elev8
Chúng tôi không chỉ là một nhà môi giới. Chúng tôi là một hệ sinh thái giao dịch tất cả trong một—mọi thứ bạn cần để phân tích, giao dịch và phát triển đều có ở một nơi. Sẵn sàng nâng tầm giao dịch của bạn?
Chúng tôi không chỉ là một nhà môi giới. Chúng tôi là một hệ sinh thái giao dịch tất cả trong một—mọi thứ bạn cần để phân tích, giao dịch và phát triển đều có ở một nơi. Sẵn sàng nâng tầm giao dịch của bạn?
USD/INR drops back to re-test 10-day SMA, while flashing 74.04 as a quote, down 0.34%, ahead of the European session on Tuesday.
Despite flashing the record high of 75.65 on Friday, the pair failed to extend the run-up while remaining below 23.6% Fibonacci retracement of its run-up from January low to the latest high.
Considering the failures to extend the run-up, coupled with softening MACD histogram strength and declining RSI from the overbought area, USD/INR prices are likely to register fresh pullbacks.
In doing so, a 10-day SMA level of 74.07 can act as the trigger for the fresh downside towards a 50% Fibonacci retracement level of 73.10. However, January month high near 72.57 could question the bears afterward.
Alternatively, buyers will wait for a sustained rise past-23.6% Fibonacci retracement level of 74.45, to aim for 75.00 and extend the northward trajectory beyond 75.65 towards 76.00 round-figure.
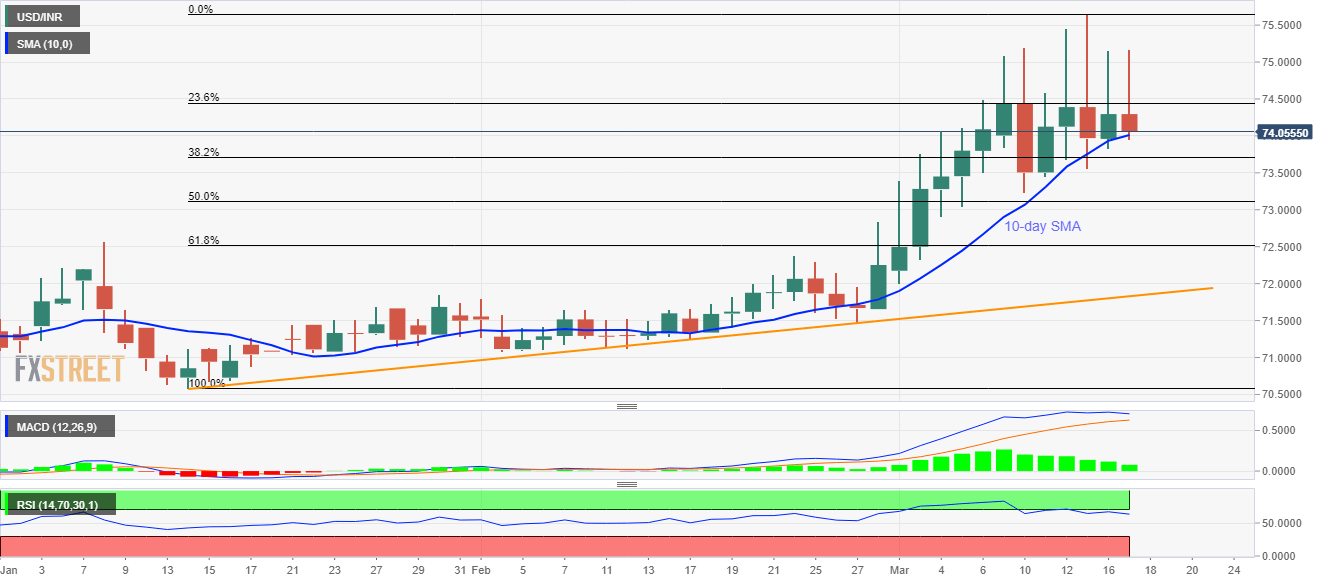
Trend: Pullback expected